When I come into the office in the morning, I have an idea of what the day will look like. I have upcoming appointments, phone calls and important projects in mind. But first I need an overview: Are there events that I need to respond to immediately? For me, it’s important to use an entry point into operational and analytical tasks. With the business analytics platform, I have access to all data. To access my ERP, SAP provides the Fiori Launchpad. Both links: Welcome to the Fiori Launchpad with CubeServ Extensions …
Highlights and limitations of the standard
As many already know, SAP Fiori is one of SAP’s most important advances within the last 10 years. With Fiori, SAP has eliminated the prejudice that UIs are often unresponsive and has followed the mobile trend well. The new Fiori-based applications are role-based, consistent and adaptive. That is, users get the right information at the right time, and the intuitive and consistent user experience runs through the entire company.
The SAP Fiori Launchpad (FLP) is the central entry point for Fiori apps on mobile and desktop devices. It displays the applications grouped in a tiled look to enable users to optimally deal with an enormous number of applications. By clicking on a tile, the user gets directly to the corresponding application, and a semi-uniform look & feel is guaranteed on all platforms.
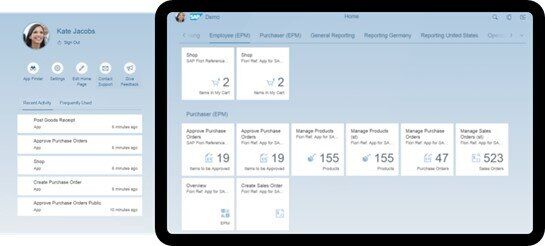
The goal of easy and quick access to apps has been achieved, and the FLP has been very well received in the market. But in BW systems only limited tile types are offered, namely static app launcher, dynamic app launcher and message tiles. An app launcher tile can only show static content or max one dynamic number.

We believe an FLP will be able to bring even more value to users if it shows more dynamic data content directly and supports meaningful data visualizations. It will no longer be just a “launchpad” but a dashboard or even a portal at the same time. This fits better with the term “Single Point of Entry”.
There are other tile types (KPI Modelers) with the support for more dynamic data, but first of all, they are offered only in S/4 HANA, and secondly, such tiles cannot be bound with Query, but only with OData Service.
That’s why we have developed a set of our own tile types that bring additional functionality such as organization of tiles and documents, improved display and visualization of BI data with micro-charts.
I have presented the topics of this blog in detail in our webinar ==> Here you can find the recording
Fiori Launchpad Extension on Premise
The FLP with CubeServ Extension then looks like the bottom left on the desktop, with more information at a glance, and much more appealing. On mobile devices (on the right), the look and feel are very similar.
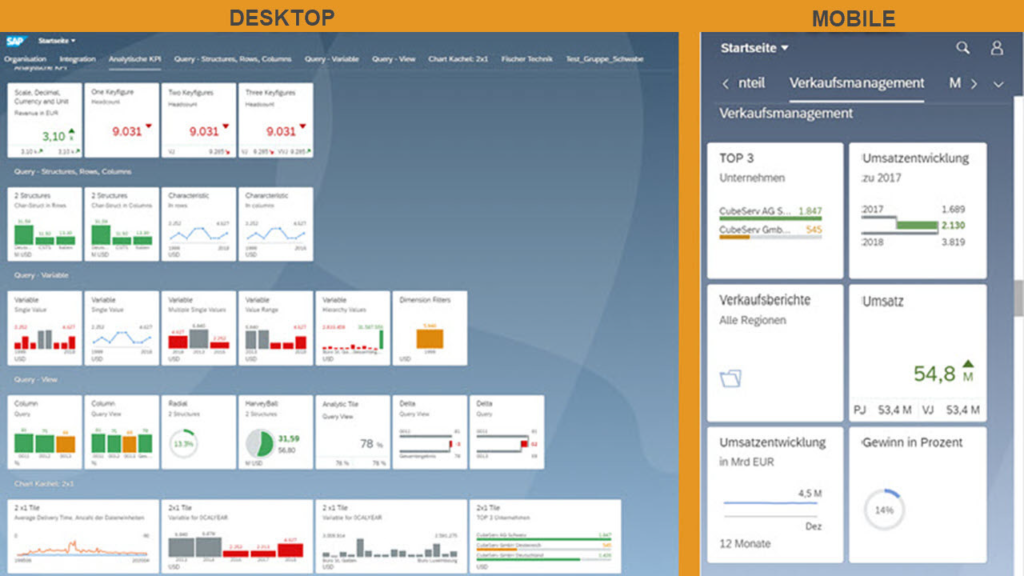
In the current On-Premise version we offer the following tile types:
- Single Tile
- Analytical Tile,
- Group/Tree Tile
- Chart Tile 1×1 and 2×1
These tile types are explained in detail below. In addition, we have a few new tile types. One of them is the one for Self Service, which is shown in a separate part.

With our extension, the “Single Point of Entry” can be connected to our BW/BI system, which often acts as the “Single Point of Truth”. You can see the situation even faster, where things are going well, where there are exceptions, where further measures are needed. This way we bring a better user experience, both in terms of work efficiency and user-friendliness
CubeServ Tile types
The standard app launcher tiles already have good integration capabilities for apps. You can set almost any app or website that can be called up via URL as a navigation target in the tiles. But the apps can only be opened in a new browser tab at a time. It lacks the in-place display feature, which is especially in demand for smartphone use because you don’t want to have so many windows next to each other. That’s why we built a simple tile type called Single Tile. And additionally, the customizable URL prefix without semantic objects is supported here. The intent-based navigation with a semantic object is very powerful, but always requires additional authorization, which is sometimes considered too complex for the admin at customers.
Organization Tile Type – Tree/Group Tile
One has had certain experiences with app groups in smartphones so far. Often, one has too many apps. In iOS and Android, this app group feature is provided so that you can group the too many apps and hide them like a “box in a box”.
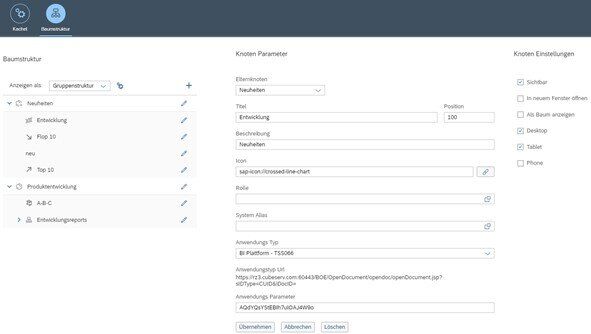
Too many tiles can also appear in the Fiori Launchpad. As a result, when there are too many tiles, you have to scroll or search a lot. This is sometimes very tedious for smartphone usage. That’s why we created a tile type specifically for such a group function. And additionally, in the same tile type, we also provide the possibility to bring and show the extensive documents like PDFs, internal web pages and our BI reports, whether Crystal, Lumira or SAP Analytics Cloud (SAC) in one place like in the classic portal. The two features are built in the same tile type because actually there is always a tree structure to maintain for organizing the tiles and documents.
Also, the tree node display can be controlled by permission roles. That is, only users with appropriate authorization can see the tree nodes. And we provide a self-service application for tree structure maintenance here. The key user can do it in a separate application.
Tile types for data display and visualization
Often you see the scenario where a user says this report is very important to me. I want to see these KPIs every day, and I want to see them in the Fiori Launchpad.
The default “Dynamic App Launcher” can show dynamic content, but only a number from an OData Service. True, OData Service is widely used for data selection with a standard syntax. But it does not automatically bring the information for data formatting and visualization. You have to provide this information somewhere by customizing and storing it extra.
But conversely, the weaknesses of OData Services are exactly the strength of BW queries. And so many queries have been developed for years. That’s why we decided to offer BW Query as a data source for our data tiles, and it’s based on the OLAP function module. Someone could ask here whether the classic function module can still be used in BW4/HANA. Our answer is that the old one doesn’t work anymore. But don’t worry, SAP has even improved this here, and standardized BAPI function modules are offered as a replacement
Data formatting and display
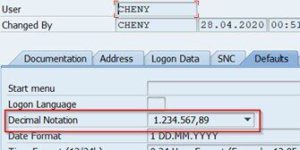
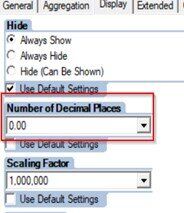
The query definition decides the number of decimal places, the scaling factor (G, M, k), and the additional information like %, currency and unit. Furthermore, the colour can still be derived via the cell exception. This makes the data and charts in our tiles look very professional, properly formatted and with colour meaning.

Data selection
For data selection, we offer support for almost all query types, e.g.
- Query with rotated axes
- Query with characteristics and key figures on the same axis
- Query with the structure of characteristics, i.e. two structures
And query views are also supported, i.e. you can save a query with its navigational state together in a view and continue to use this view as a data source. e.g. a standard query has a few summary rows for certain drill-down characteristics. We can hide this sum in AfO, store it in the view and then add it to the tile as a data source.
And we also provide support for so-called web API, so e.g. filtering with BEX variables and breakdown characteristics, axis change, drill-down (expand and collapse) etc. can be easily implemented by parameter transfer.
Of course, you have to know the API commands well. This should not be a problem for experienced BW colleagues.
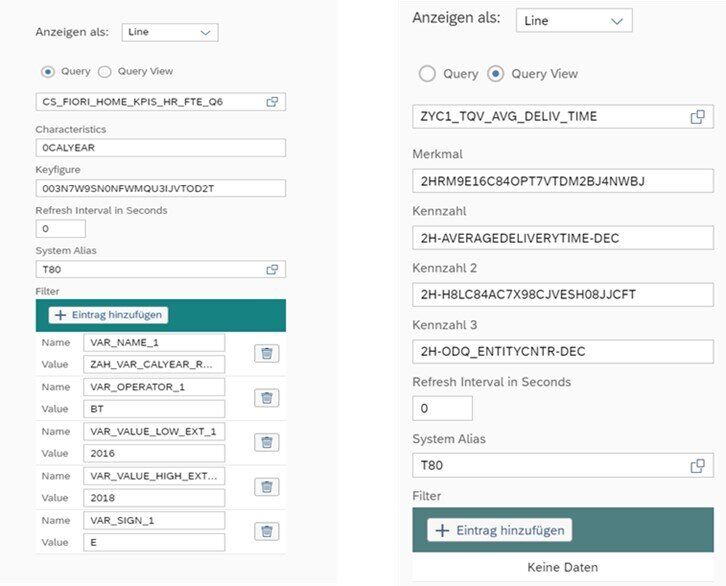
With this 3-level support, query, query view and parameter passing, customizing tiles has thus become much more flexible and efficient. One can easily reuse their existing queries for different tiles multiple times. For example, we can imagine using a query on the company level, their views for the sub-organization, and a parameter passing for special user requests.
Analytical and chart tile
In terms of data tiles, we basically have two types of tiles.
One is the analytical tile, which you can see here! Here you can distinguish between the variants in one / two / three key figures. Often you want to see for the same key figure an old value, e.g. from last year, a current year value and a planning value for the next year. This is exactly what our analytical tile can do; while the standard “dynamic app launcher” can only show one number.
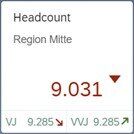
The other type of tile is the Chart tile. Here you can select the different MicroCharts.
- Column chart and line chart mainly for data trends
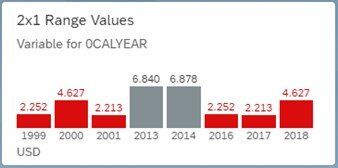
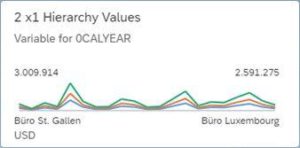
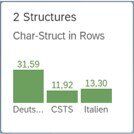
- Comparison chart and delta chart for data comparisons
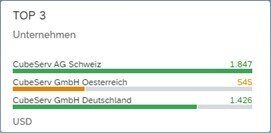
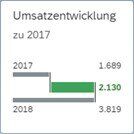
- HarveyBall chart and Radial chart more for a proportion value
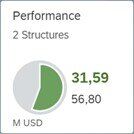
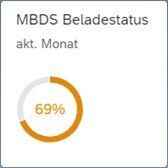
The Line Chart tile has the special feature that up to 3 data series can be displayed at the same time, while other tiles can only show one data series.
For the tile size and layout, we distinguish between 1×1, and 2×1 tiles. Often a 1×1 tile is enough, but in some cases, we have more texts or more data to show.
Query Viewer and Self Service with Fiori Tiles
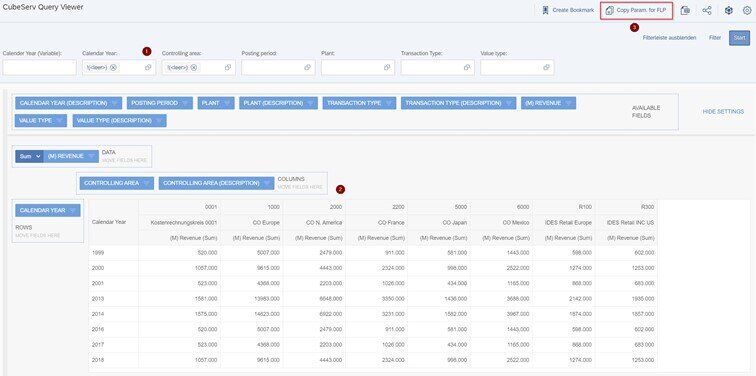
This allows you to query not only queries. Key-User or BI-Admin can copy the whole view as one parameter into the FLP-Designer. You no longer need to know what the characteristics and key figures are called, just click the “Copy Param. for FLP” button and then in the “Customizing” tile click the “Import Param. ” button. Then the parameters are already filled in. Self-service for key users is already conceivable, but at least more efficient for the BI admin.

You can also create a “bookmark” for the data view you created in FLP. You specify the query view and click the “Create Bookmark” button.
In the popup window, you enter the title, subtitle, information and icon and click the “Submit” button.

And you then get a new tile, called a bookmark, in your home zone, “My Home Page”. “Bookmark” is a specific type of tile that can be created and deleted at will by the user in the production system. Such bookmarks can be dragged into any tile group or optionally created directly into the desired group (not shown in the last screenshot).

And all users can quickly share the query view with others via URL and thus have it converted to tiles faster. In the end, the data can also be exported 1:1 to Excel, as you can see.
Fiori Launchpad Extension Cloud
Cloud computing has rapidly changed the way companies buy and use technical resources. What started as a simple website hosting service has evolved into a variety of cloud services. It brings clearly visible benefits to the business in terms of cost, flexibility, reliability and security, etc.

Both the architecture and the offerings in the cloud are different from on-premise. In the cloud, the world is service-oriented. The portal can also be seen as a service and the FLP is available as a page variant in the portal. In order to get the data from the backend, e.g. the BI KPIs, you have to set up the Cloud Connector and Destination to the BW server additionally.

The advantage of the SAP Cloud Platform (SCP) is that you can quickly use many up-to-date services. For example, with SAPUI5 you can select both the latest version and all versions still supported by SAP per portal page. With it, you can enjoy the latest SAPUI5 feature and have great flexibility. I can remember that a few years ago in a customer project with the low version of 1.28 the drag & drop still had to be programmed completely with Native JS because the server could not yet be upgraded to 1.47, where drag & drop is already provided in SAPUI5. This not only cost the customer more budget but also led to more complexity in the development.
Specifically, on FLP, we can say that it has a similar look and feel to on-premise, just as SAP promised. For end-users, there is hardly any noticeable difference. But when it comes to customizing and development, there are a few differences.
The currently available Fiori Launchpad in the SAP Cloud Platform (Neo) can only show static content or only a number from an OData service in a tile. Custom tiles are also supported in the cloud version. The implementation and deployment for this are quite simple compared to on-premise.


But there cannot be displayed a customized configuration interface per tile type. Only a generic configuration interface is used. In on-premise, the implementation is more complex but offers much more flexibility. In on-premise, different settings can be made per tile type: sometimes populate the query data, sometimes define the tree structure, etc. In the cloud version, this is not possible directly!

Nevertheless, we stretched our extension package further into the SCP and offered similar tile types. And by using a separate customizing application, we were able to partially bypass this limitation in the configuration interface.
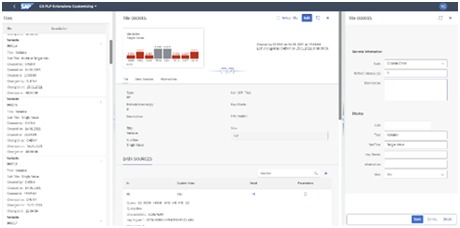
Finally, the Fiori Launchpad with our extension for end users looks very similar to on-premise. The difference is only noticeable when customizing.

Project report
We have installed the extension package for several customers over the last two years. Some customers prefer to use the tree tiles to record the BI reports neatly in FLP. However, some customers like the KPI and chart tiles more. We have already seen different needs from customers. In my first customer project with this extension package, our chart tiles were still newly developed at that time, but the IT from the customer side had been quite demanding on many details, and also made many extra requests, e.g. support for query views and parameter transfer etc.
Based on this, we have invested more time than actually promised in examining and implementing such requirements and proposals. The whole process was very constructive.
In the end, we had a successful project and the customer was also very satisfied. Not only was the package successfully installed, but we also had some know-how transfer about FLP and its extension and even a bit of SAPUI5. Moreover, the customer side helped us with their suggestions to improve the extension package even more. And the colleague from the IT department also agreed to be our reference customer.
Have I aroused your interest? I look forward to hearing from you.
