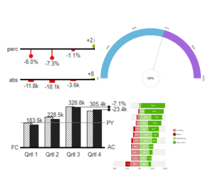
SAP Analytics Cloud (SAC) is the preferred data analysis tool for many companies. With the help of various graphical elements, you can present your data in SAC in a comprehensible way.
If you want to personalize your reports and present them in your corporate colors, SAC offers a framework that allows you to integrate your specific graphical elements (custom widgets) into SAC.
In our training video and in the text below I explain what you should pay attention to when developing your own Custom Widgets.
Requirements
- A web server is required for the source files. If you don’t have one yet, I recommend GitHub. This platform is well suited for training purposes.
- JavaScript is used as the development language. The metadata and links to source files are loaded into SAC using a JSON file (JavaScript Object Notation – the universal standard for data exchange).
Once the interface is enabled, you can start configuring it.
Structure of the JSON file
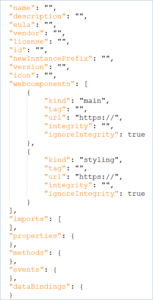
A simple custom widget that also has additional custom properties should contain at least “main” and “styling” data under “Webcomponents” tag.
You can see the structure of a JSON file on the right.
I recommend using a base64 encoded image for the icon. You can convert the image online (e.g.: Base64 Image Encoder)
Structure of the JavaScript file (JavaScript API)
The JavaScript file contains an HTML <template> element. This is a mechanism for holding HTML that should not be rendered immediately when a page is loaded, but can be instantiated later during runtime with JavaScript.
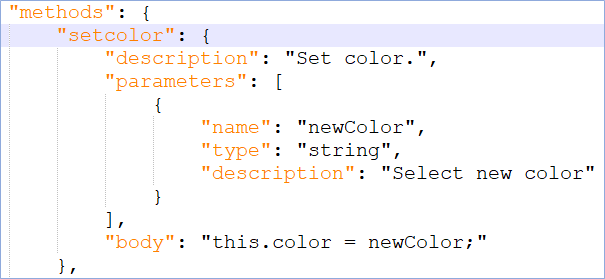
The JavaScript file consists of a JavaScript function with a class with corresponding declarations and methods.
It includes:
- Constructor
- onCustomWidgetBeforeUpdate – called before updating the custom widget.
- onCustomWidgetAfterUpdate – called after the custom widget is updated.
- connectedCallback – is called when the widget is added to the HTML DOM of the page.
- disconnectedCallback – called when the widget is removed from the HTML DOM of the page.
- onCustomWidgetResize – called when the size of the custom widget is changed.
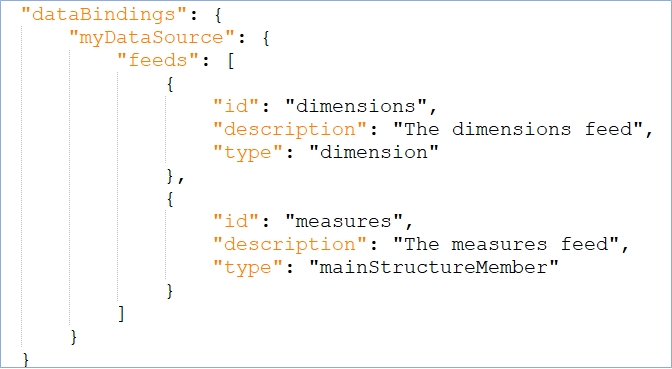
Data can be evaluated in JavaScript using these methods:
- parse() – method parses a JSON string and converts it to a JavaScript object.
- stringify() – method converts a JavaScript value into a JSON string.
Once the development is complete, the custom widget can be loaded into SAC Analytic Applications.
Templates and documentation
The files already created can be used as templates. Here is an example with the pyramid diagram:
SAP_CustomWidget_Pyramid/main-component.js
SAP_CustomWidget_Pyramid/styling-component.js
SAP_CustomWidget_Pyramid/contribution.json
SAP also provides Documentation in English.
Inspirations
Want to be inspired by other creative ideas? Here you have some possibilities:
Chart Demos – amCharts
Extensions Archiv – graphomate
Examples – Apache ECharts
D3 Gallery – Observable

Import SAP analysis authorizations into Power BI
We take a look at the question of whether it is possible to import SAP analysis authorizations directly from SAP and thus integrate them seamlessly into Power BI. Read our article and find out more about the possibilities.

Transfer data to SAP BW via REST API
Our training video on the REST API interface in ABAP programming shows how you can transfer data from other data sources to the SAP Business Warehouse (BW) and process it there.

Mobile Reporting with SAP Analytics Cloud or MS Power BI
Take control of your data: Mobile reporting with SAP Analytics Cloud or MS Power BI. In this blog we show the strengths of the solutions.

