R programming language is one of the most popular languages when it comes to data science and statistical analysis. This is mainly because R was specifically built for statistical key figures and data analysis. While R was developed in the early 90s, it wasn’t until the rise of data science that people started relying on it.
In today’s article, we will comprehensively go through the R programming language. You will find out why R language can be an invaluable asset for you and you will learn how to set it up. Don’t worry if you have no prior knowledge in programming – I will explain everything to you from the scratch. So, let’s get started.
Why Should You Use R?
When I first learned the R language, I was under the impression that it was only suitable for statistical work. However, as I advanced further, my initial impression of R turned out to be wrong. R has actually a lot more going on than just statistical work. Let’s see some of the top reasons why using R can be of great benefit to you.
1. Easy to Adapt
Just like Python, R has a very user-friendly syntax . Even if you don’t have a programming background and you are only interested in using R for visualizations or analysis, you can easily learn to understand and work with the R language.
The documentation is top-notch, and it won’t be long till you start getting what you want out of the language even if you have only little or no programming skills. You can also use it for other tasks such as Automation, e.g., RPA.
2. Fast Data Analysis/Visualization
One of the best things about R is that it’s fully packed with excellent libraries. As a matter of fact, there are over 7800 packages available that let you instantly do a variety of computational and visualization tasks. In addition, there are packages available for advanced analytics that are rarely found in other programming languages.
Moreover, R has great community support. Data scientists and statisticians all over the globe will be ready to provide support in case you need help. There are hundreds of online forums available that offer support.
3. Convenient ML Algorithms Implementation
Implementing Machine Learning algorithms is very fast and efficient when it comes to R. You will not have to take care of everything from scratch like you would have to in JAVA. Instead, things are already created and optimized for you on the abstract level.
The Basic Elements
If you would like to use the R language, it is essential to understand the basics. Therefore, we will now discuss some of the key features of R.
Objects
Everything you see or create in R is basically an object. Don’t get confused with the term. There are no particular prerequisites for something being declared as an object. Whatever it is, if it exists in R, it’s an object. Further on, there are some classes of these objects that are listed below:
- Integer
- Numeric
- Character
- Logical (Boolean)
- Complex
Again, don’t worry about the term ‘class’; it might sound a little confusing if you don’t have a programming background. You can just imagine a class as an instance of an object.
Further on, each class has a set of attributes; that’s basically how a class is defined. Just like human features such as their name, height, sizes are used to describe humans. Here are the attributes:
- Names
- Dimensions
- Length
- Class.
Data Types
Apart from the primitive types of objects we saw above, there are different data types available in R that are used in data processing. Let’s see some of the most used data types along with their usage.
1. Vector
A vector is essentially a list of objects of the same type — for example, a vector of characters, integers, and so on. You can input different types of objects in the same vector, but R then converts the different types to the same class. This phenomenon is known as coercion.
2. List
If the vector contains entries of the same class, you might ask, what happens if you want to include entries of different classes? Well, a list can do just that. Lists are basically a special kind of vector that can contain objects of different classes.
3. Matrices
Matrices are two-dimensional data types that can contain data in 2d. Matrices are formed when you introduce rows and columns in vectors. Note that a matrix can also include data belonging to the same class.
4. Dataframe
If you’re a data science aspirant, this will probably be your most used data type. Dataframes are a tabular form of data type that can store and view data just as an excel spreadsheet. But if dataframes are also 2d, it might wonder what the difference between a matrix and a dataframe is? Well, dataframes can contain data belonging to different classes.
Some Useful R Packages
As mentioned before, there is a massive list of R packages one can use, depending on the requirements.
I often work with:
- ggplot2: a package to create simple graphs
- dplyr is the package that can be used for data manipulation
- tidyr helps to create adjusted data.
- shiny creates web application without JavaScript .
- quantmod: quantitative financial models – financial data can easily be downloaded and analyzed online from Yahoo and Google Finance. For example, with the commands
> DAX <- getSymbols(“^GDAXI”, auto.assign = FALSE) > plot(DAX$GDAXI.Close)
you can read all DAX prices since 2007 and plot the closing prices. - bigmemory: If the data does not fit in the main memory.
- sqldf: SQL on Data
- DBI: Database Interfa
Installing R / RStudio
Studying theory alone is never good enough. Whenever you learn something new, it is important to consolidate your skills through practice. Therefore I recommend you download RStudio now to get started with R. Simply follow the steps mentioned below and soon you will have the IDE ready.
1. Install R
https://cran.r-project.org/bin/windows/base/
Go ahead and download the R programming language on your machine.
2. Download RStudio
If you’ve programmed before, you know that downloading a language alone is not enough, and you also need to download and install an IDE to code in that language. So, let’s download RStudio, the IDE for programming in R.
Click on the link to open the official website of RStudio: https://www.rstudio.com/products/rstudio/download/#download
Note: This link is for Windows users only. If you’re operating some other OS like Mac or Linux, scroll down to see available links for your respective OS.
Once you clicked on the download button, the setup file will automatically start downloading. You might have to wait a couple of minutes to finish the downloading process, depending on the speed of your internet connection.
3. Installing RStudio
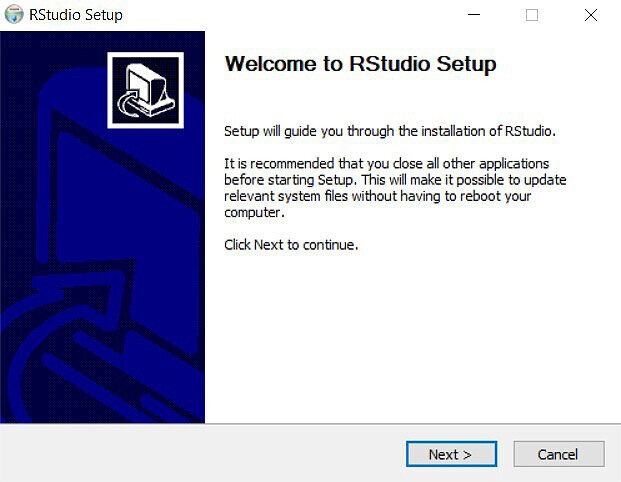
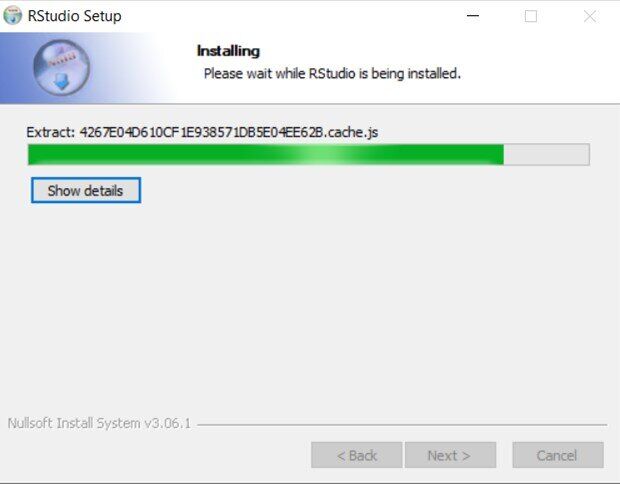
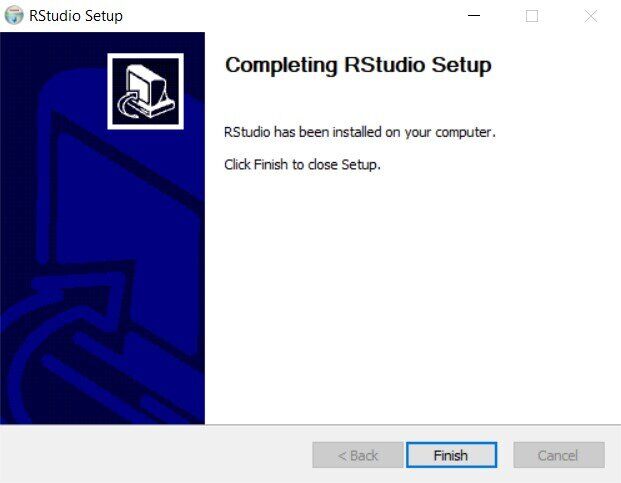
Once the setup file is downloaded, open it and the setup wizard will open in the next step.
Installing R Packages
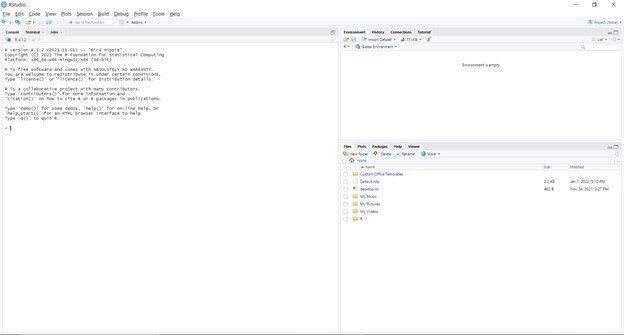
As mentioned before, R needs packages. This section will show you how different packages can be installed in RStudio.
Open up RStudio from the Windows search bar and click the console.
If you want to install ggpot2. for example, you can use the following link:
Install.package(“ggplot2”)
That’s all you need to do. If it’s your first time installing a package, there might be some CRAN dependencies that will get installed automatically. I recommend to ignore them for now. Also, you can type this installation command into a notebook or an R file and execute that, but I find the console better for such short tasks.
Load a File
For example, if we want to import a CSV file containing our training data; how do we do that?
To load a file manually, click on Workspace > Import Data > From text file and then select the file you want to load. You will be provided with some import options when choosing the file. If you’re loading some dataframe, ensure that the Header is set to Yes and the column names exist in your file.
Once you have your file loaded, you can start doing whatever you have in mind with your file.
For importing other types of files, feel free to take a look here.
Conclusion
R is a prevalent programming language in the world of statisticians and data scientists. Today in this article, we learned why it can be highly beneficial to know R and how it can speed up your processes by for example its quickly adaptable syntax, the wide range of packages available and the great community support.
We also understand now some essential key features to start with the language and the preliminary steps, such as loading a file and installing packages. In the following articles in this series, we will be doing more advanced tasks such as making visualizations and processing data.
