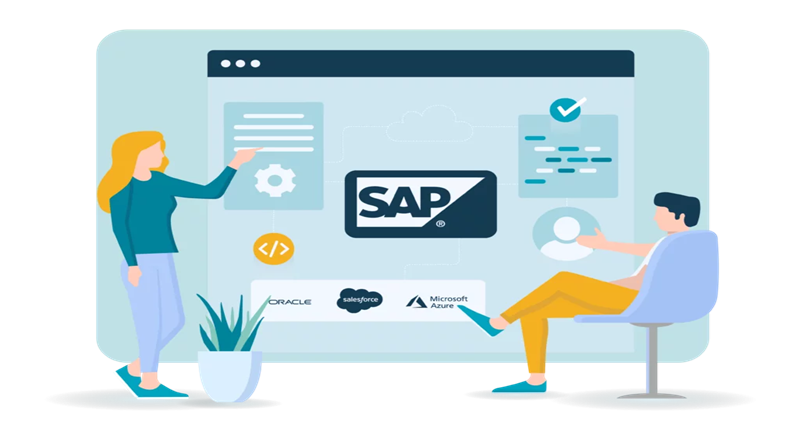
Why bother with SAP R integration? The vast majority of organizations use advanced analytics with R and SAP tools to forecast future events and make data-driven, informed decisions. With this blog post, I highlight the benefits and essential connections.
SAP’s R integration approach
SAP’s commitment to R was unique compared to that of other technology companies. The company has invested a lot of technical capital to make its products compatible and consistent with R without hyping it too much before the products were ready. SAP has a two-pronged strategy. The SAP Business Objects predictive analytics suite combines R’s strengths in statistics with a visual interface that makes it much easier to generate insights and analysis than standalone applications.
When combined with the RHANA kit, the in-memory HANA appliance makes it easier to push data into HANA, summarize it, aggregate it, and process it analytically. Thus, the visual interface and in-memory processing for faster data operations on larger data sets combine R’s strengths without its conventional weaknesses (especially with larger data). SAP customers benefit from faster data access and simpler user interfaces thanks to this innovative combination of technologies.
SAP and R create added value
Predictive analytics capabilities for pattern recognition are supported by SAP Business Objects Predictive Analysis and allow users to build predictive models through a visual drag-and-drop interface, reducing model design time.

One of the most fascinating aspects is that R is increasingly seen as the best tool for Big Data analytics through cloud computing, even though it was once considered unsuitable for big data on the desktop. The reason is simple: R stores data in memory, or RAM.
The open-source nature of R means that any large technology company that wants to play in the lucrative business analytics market can easily adopt and adapt R for its use cases, especially as memory and RAM prices continue to fall. In addition, R is also compatible with the Hadoop ecosystem.
Methods and best practices for integrating SAP with other processes
SAP is a fantastic technology that can completely change the way a business operates. It is extremely configurable and can handle a wide range of processes and variations right out of the box. However, it also can’t do everything. It often requires SAP to integrate with other systems. This is because SAP is the heart of the business and contains data that other applications need to function.

In addition to the company’s central master and transaction data, numerous checks and business rules are also defined. It makes no sense to recreate the same thing in another application.
Instead, when integrating third-party software with SAP, all code remains in one place, ensuring that any changes to rules are reflected across the landscape. To ensure a balance between user autonomy and efficient processes and governance, strategy and data governance are where you should focus your attention. I have covered this in more depth in this blog.
SAP Analytics Cloud (SAC)
SAP Analytics Cloud, also known as SAC, is a cloud-based data visualization platform from SAP.
SAP Analytics Cloud is a single tool that includes the following functions:
- Predictive Analysis
- Planning
- Business Intelligence (BI).
When it comes to business intelligence, SAP offers a comprehensive solution. SAC, which is available online in SaaS mode, is becoming increasingly relevant in the SAP ecosystem. It is destined to become the BI reference tool of SAP Cloud Suite in the future.
Data Modeling
This enables data planning with additional features such as including metrics, formulas, and changing the values of recovered features.
Data Visualization
With this feature, you can use charts, tables, and other graphical elements to explore and highlight your data.
Analytical Prediction
SAP has used artificial intelligence technologies to map specific indicators or predict future outcomes. Automated content development through intelligent discovery, identification of influential features, and detection of data sets that are not trending are just a few examples of these innovations in action.
Organize
The SAC preparation part allows you to combine your financial and operating statements in one method to get a complete and accurate picture of your current situation.
Current financial statements can be used to create and modify versions of the budget preparation. Machine learning and predictive forecasting software are available to help you forecast your financials for future dates. The usual “what if” mode is also available for simulations.
Visualizations and Graphs
Thanks to the integration with R, SAP Analytics Cloud can display all kinds of graphics you can think of. I myself have used the decision trees or even the distribution of large amounts of data.
Benefits of R and SAP Predictive Analytics
Numerous statistical and analytical methods are used to mine large amounts of data for hidden trends and correlations. Customer behavior, product demand, sales and revenue, and much more can be predicted using R and SAP tools.
Automated analytics, expert analytics, model management, data management, predictive scoring, social media analytics, product evaluations, and visualization are covered with advanced analytics using R and SAP tools. Machine learning workflows can be created with the drag-and-drop interface, with no coding required.
Expert Analytics is aimed at experienced data analysts and data scientists, while Automated Analytics has a low barrier to entry for business users. The lifecycle of predictive models is simplified and automated with Predictive Factory.
In a small blog series, I’m looking at the different aspects of business analytics. Published so far:
- Part 1: How to make business analytics successful?
- Part 2: Business Analytics vs. Business Intelligence
- Part 3: What is SAP Analytics? The SAP Data Warehouse Portfolio
- Part 4: SAP Analytics – The Front End Products
- Part 5: Data Platform – An Important Pillar of Digital Transformation
- Part 6: On the way to AWS
- Part 7: Cloud – Curse or Blessing?
- Part 8: Leading with data – why Power BI is often a choice

