The previous parts of this blog showed how the sensor data from the factory simulation was finally made available as a table (more precisely: as a table link) in SAP HANA.
The next step would now be to create a scripted (or alternatively graphical) CalculationView in HANA, for example, which reads the messages from motors Q2, Q3, and Q4 as follows (using Q2 as an example):
SELECT count(*) FROM "DATA_EXTERN"."IMPALA_ZCSSENSORQ" where "sensor" = 'Q2' and "value" = '1';
Unfortunately, we ran into a bug in the SAP adapter, the adapter produced an incorrect query with nonsensical “N” literals in the query:
Could not execute 'SELECT count(*) FROM "DATA_EXTERN"."IMPALA_ZCSSENSORQ" where "sensor" = 'Q2' and "value" = '1'' in 89 ms 673 µs . SAP DBTech JDBC: [403]: internal error: Error opening the cursor for the remote database Failed to execute query [SELECT COUNT(*) FROM `sapt90`.`zcssensorq` `IMPALA_ZCSSENSORQ` WHERE (`IMPALA_ZCSSENSORQ`.`sensor` = N'Q2') AND (`IMPALA_ZCSSENSORQ`.`value` = N'1')]. for query "SELECT COUNT(*) FROM """sapt90"".""zcssensorq""" "IMPALA_ZCSSENSORQ" WHERE "IMPALA_ZCSSENSORQ"."sensor" = 'Q2' AND "IMPALA_ZCSSENSORQ"."value" = '1' "
This error in the Impala adapter is already described in SAP Note “2562391 – No SQL query against a virtual Impala table with literal string in the WHERE condition”. Unfortunately, the solution is not a simple patch, but the SDI agent used from release 1.0 must be replaced by a 2.0 installation. As existing connections that use this agent are lost in the process and have to be recreated, the installation of a new 2.0 agent was carried out separately, but modeling was continued with the faulty 1.0 agent in order to obtain a functioning prototype as quickly as possible. Since WHERE-conditions cannot be fired against the Impala adapters and Impala should be used because of its better speed compared to Hive, the following was done:
- In addition to the zcssensorq table, the zcssensorq2, zcssensorq3, and zcssensorq4 tables have already been filled on the Hadoop page, and only for the table rows where the sensor value = 1. The tables therefore only contain the active messages of the corresponding Q sensor and nothing else. This means that only the rows of the table have to be counted without any WHERE condition.
- A CalculationView was created in the HANA, which performs the following count:
tmp1 = select count( * ) as "COUNT_Q2" from "DATA_EXTERN"."IMPALA_ZCSSENSORQ2";
tmp2 = select count( * ) as "COUNT_Q3" from "DATA_EXTERN"."IMPALA_ZCSSENSORQ3";
tmp3 = select count( * ) as "COUNT_Q4" from "DATA_EXTERN"."IMPALA_ZCSSENSORQ4";
var_out = select "COUNT_Q2", "COUNT_Q3", "COUNT_Q4" from :tmp1, :tmp2, :tmp3;
Unfortunately, even this WHERE-free coding leads to a query error due to the bug in the Impala adapter. The reason is that HANA optimizes this query and WHERE conditions arise again. As a workaround, the system was forced to abandon this optimization and actually process it sequentially. This was achieved by the following commands, which contain the crucial words “SEQUENTIAL EXECUTION”:
drop procedure "_SYS_BIC"."pg.ccedw.sfb18/ZTS1_CV_SFB_COUNTER_Q24/proc";
create procedure "_SYS_BIC"."pg.ccedw.sfb18/ZTS1_CV_SFB_COUNTER_Q24/proc" ( OUT var_out "_SYS_BIC"."pg.ccedw.sfb18/ZTS1_CV_SFB_COUNTER_Q24/proc/tabletype/VAR_OUT" ) language sqlscript sql security definer reads sql data
as
/********* Begin Procedure Script ************/
BEGIN SEQUENTIAL EXECUTION
tmp1 = select count( * ) as "COUNT_Q2" from "DATA_EXTERN"."IMPALA_ZCSSENSORQ2";
tmp2 = select count( * ) as "COUNT_Q3" from "DATA_EXTERN"."IMPALA_ZCSSENSORQ3";
tmp3 = select count( * ) as "COUNT_Q4" from "DATA_EXTERN"."IMPALA_ZCSSENSORQ4";
var_out = select "COUNT_Q2", "COUNT_Q3", "COUNT_Q4" from :tmp1, :tmp2, :tmp3;
END /********* End Procedure Script ************/
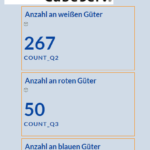
This trick is of course only a temporary workaround and is not stable against reactivation of the CalculationView, for example. As an emergency solution, this scripted CalculationView now counts the table entries as desired:
The duration between triggering the corresponding motor and the counting up of the counter is approx. 4 seconds. This view has now been integrated into SAP Analytics for Cloud. Unfortunately, there is no display there that updates itself periodically, so you have to keep refreshing the display to see the changes in the counters.
Overall, the architecture looks like this: Sensor data is written by the control devices into a CSV file, this is imported into Cloudera via Kafka, this is available in a HANA via an adapter in the HANA database, and SAP Analytics for Cloud displays this data. There is no SAP BW involved in this architecture. In the next part of this blog, I will discuss how it is possible to easily move such data back and forth between Hadoop and SAP BW.


