Who could have guessed the unprecedented global impact and disruption of COVID-19 when the first news appeared in early January 2020?
Companies with exposure in China were hit early and fast but even then, nobody did foresee and most probably did not forecast a global disruption, nor did they run scenario based forecasting on that, nor did they have tools in place like SAP Analytics Cloud.
All that changed in early March when COVID-19 arrived in Europe. Governments were doing their best to control the spread with different phases of Lockdowns.
At the same time, the management boards were faced with an unseen array of challenges which were unique to their business, their global footprint and even down to different business units. There were so many questions to answer without having a clear view into the future and so little time. What about the Supply Chain, Liquidity, Sales numbers etc. as well and most important, the well-being of the own Employees?
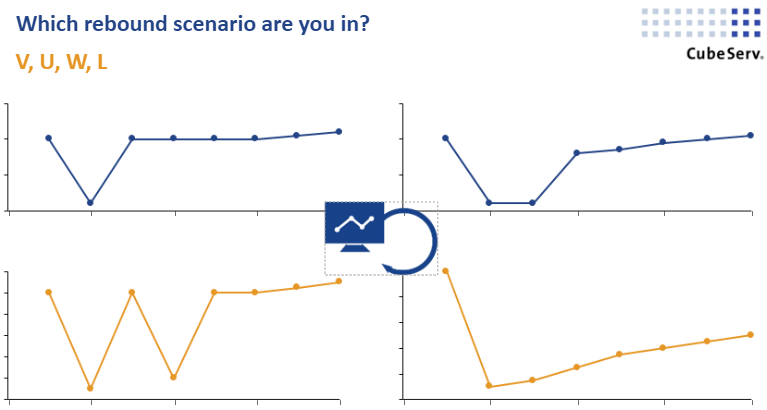
I trust that today (Mid June 2020); most companies are in some sort of rebound scenario or likely in a combination of various scenarios:
- V– Fast but limited impact, almost back to normal
- U– Fast impact and slowly but steadily recovering
- W – Fast impact and hopefully not a second wave either Corona or e.g. GDP decline in some of your main markets
- L – Fast impact but slow, continuous improvement
As mentioned before, companies are likely still facing lots of uncertainties and the FP&A Teams need to deliver and live up to the expectation of their management.
When I talked to our clients, there was, not surprisingly, a varied picture. Bottom line however is, that companies who invested into Business Partnering, agile processes and appropriate Software are better at managing the current crisis and feel more confident with their planning results.
Let’s look exemplary at Forecasting and Scenario-Planning:
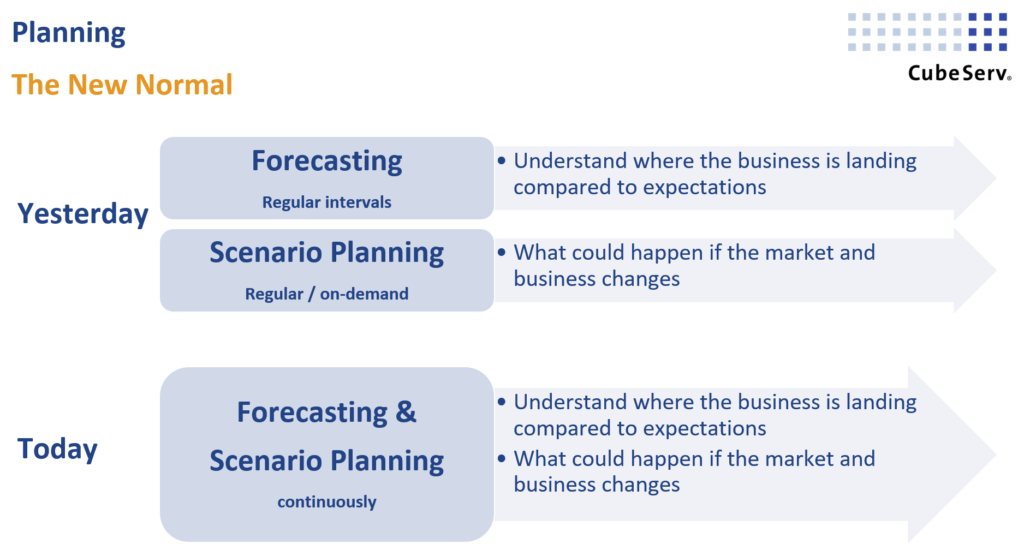
In the traditional way, these are two separate topics. They are very likely run by different Teams with different background and knowledge. Forecasting is run at regular intervals and Scenario-Planning rather on-demand. While there is a Software solution in place for Planning/Budgeting/Forecasting, Scenario-planning might be an Excel solution.
However, there is an urgent need to move from Yesterday to Today.
The circumstances or basis for the Forecast changes so fast that it is basically impossible to come up with a solid Forecast based on historical data. As well, the scenario plans undergo fast changes and they must be adapted fast.
In other words, Forecasting and Scenario Planning are melting for the time being but maybe also in future.
Time for Changes
There is a need for a change to address this. Switch from a granular bottom-up to a high level top down approach and run the forecast more frequently. To accommodate this, internal processes need to change. The Teams need to change as well from a pure FP&A or Business Team to a Team with Senior, cross-functional experts who focus on a few but the right business drivers and KPI’s.
This Team acts swiftly and frequently runs the Forecast and has the Market and Business knowledge to run appropriate Scenarios.
Additional dedicated teams are still needed for deep dive analysis and forecasting on a granular level.
All above needs to be supported by an agile Software solution which can be run and operated independently by the business.
Just take a moment and try to reflect this to your current situation
- Are you able to put together such a Team at short notice?
- Do you know the few but important and right business drivers?
- Can you measure them?
- Do you have a software solution which does support you in finding the right drivers?
- Does this solution support Predictive topics, Scenario-based planning, and the usual Forecast? And in such a way does it take out a certain Human-Bias in the analysis?
- Are you able to make use of it in a way of Self-Service or do you need to launch IT Projects / Change Requests first?
Obviously there would be many more questions. If you cannot answer all of them with a clear YES, there is a Call to Action.
Only about one fifth of large multinational companies were ready to respond to the management expectations.
I am not talking about a lengthy project with lots of people involved, hardware purchase etc. I am talking about a lean and fast project with the SAP ANALYTICS CLOUD (SAC).
You only need a Laptop, an internet connection, a browser, a license and the appropriate data set and there you go. Either you connect live to your ERP and/or Datawarehouse Systems or just import the data via Excel file into the Cloud.
For more information about the SAP Analytics Cloud, visit our SAC homepage and watch our Webinar for a first introduction: Challenging Times for Finance & Controlling Dashboards, Augmented Analytics and Planning
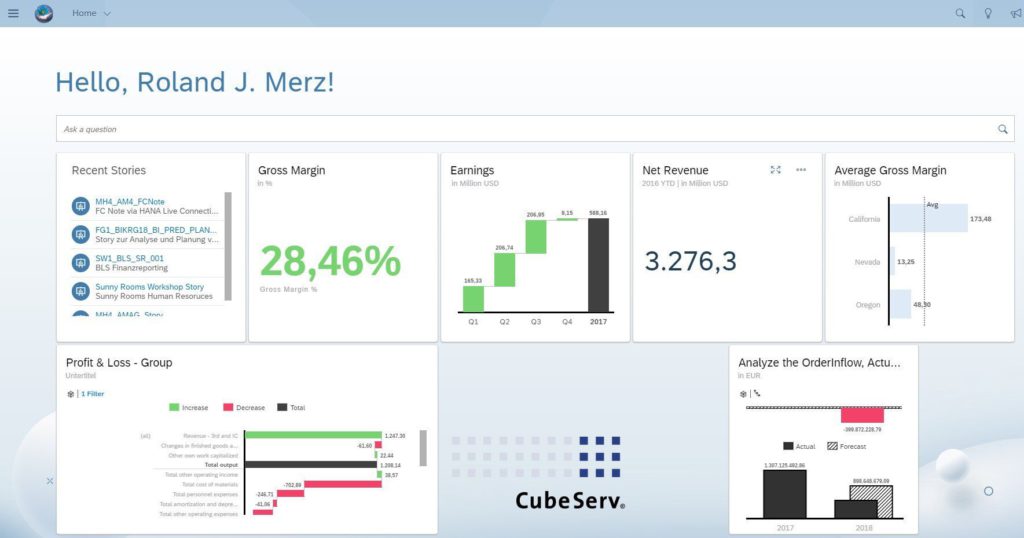
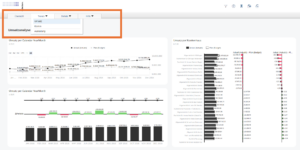
Once you have the data, you can start building your own Stories (Dashboards) which you populate with Reports, Analysis, KPI’s, interactive Forecasts and Scenarios. All these, you can build on your own without relying on strained IT-Resources and avoid the hassle of lengthy change requests.
The Augmented Analytics features (see my Blog and Webinar to this topic) supports your efforts in an easy way to get more insights into your data and to get a solid Scenario-based forecasting which you can adjust and run anytime based on real time data.
We will demo all this during our forthcoming Webinar on 18th June 2020 and gladly invite you to participate. Should the time not fit your schedule, just get in touch with us for a 1:1 session.
- 18th June 2020 – 10.00 hrs – Simplify Planning & Scenario-based forecasting with one cloud solution
The Webinars audience are the Finance and Controlling teams but, of course, everyone is welcome to join. It will always include Live Demos and be held in English.
Duration: approx. 60min, all times are CEST.
We are looking forward to get in touch with you.
