COVID-19 is a typical Black Swan event. Nobody could foresee the global impact on our business and daily life. Rapid changes happened in HR but also other areas.
We all struggle to get a clear picture about the future. Optimism helps and let us hope that the New Normal will be for our best.
I wrote about the impact and challenges for Finance and Controlling in my previous blogs.
Today, I like to have a look at one of our most precious “assets” in the company and this are our employees.
Importance of HR changed dramatically
According to the “CEO Outlook KPMG”, HR has moved from an important matter to the most important matter since beginning of 2020. At the beginning of 2020 only about 1% of CEO’s thought that HR is business critical, this number increased to 21% by Summer 2020.
The workforce was and is heavily impacted by various matters
- confronted with COVID-19 cases personally, in the family, in the office
- remote work
- stressful conditions
- having to work on-site exposed to risks
- uncertainty and anxiety, potential layoff
- and many more depending on the job area
Top Priorities of employers around the world
The examples set out below show a heartening and overwhelming dedication by HR departments in Top Employers across the world to safeguarding excellence for their employees, as they go about their everyday working lives.
- DHL Freight (France): Anticipation, protection and communication.
- Coca-Cola: Information, support and aid
- Infosys (Switzerland): Wellbeing, continuity and community action
- Covestro (China): Timeliness, agility and empowerment
- Takeda (Brazil): Understanding productivity, limiting stress
- BAT (France): Communicating early, often, and informally
Source. https://www.top-employers.com/
Were you prepared?
Some HR organisations were better prepared than others to react effectively when the crisis hit.
Let us have a look at some of the reasons for that
- HR has been a strong business partner before already
- HR has a deep understanding of the workforce and understood their challenges which arose due to the pandemic and were swiftly able to mitigate those
- HR has an up to date operating model and high degree of automation
- HR avails of the right skills
- HR has access to the right information
HR needs access to the right information
I would like to elaborate more on “HR has access to the right information” since this is a key topic in our consulting for over 15 years.

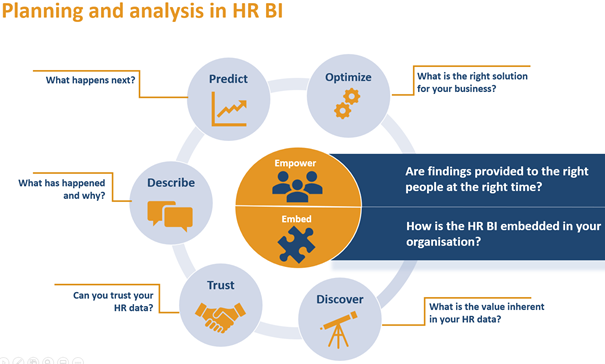
Having a clear picture about the workforce is eminent important. There are so many questions to answer:
Most medium to large sized companies have up to date HR Software in place. Those software covers a magnitude of operative functions but often fall short when it comes to reporting, analyzing, simulation and planning.
HR is different to Finance and Controlling. Almost all attributes of an employee’s master data is time dependent. In addition, the organisations keep changing frequently and all these is challenging to manage properly in data models and lateron in reporting.
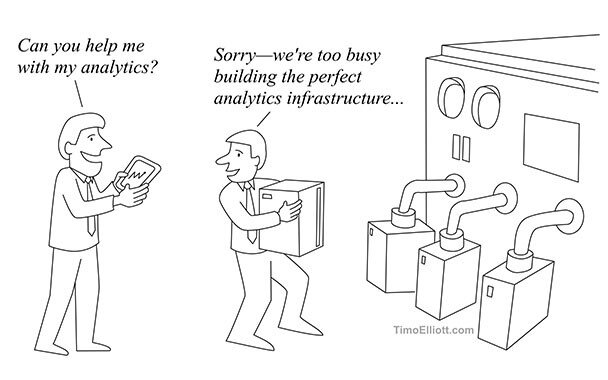
The whole process to reflect organisational changes, build new reports and analysis is cumbersome and often relies heavily on the IT-Department.
And of course, for an integrated reporting as well as planning, you need to combine your HR data with Finance data and for Production planning, you will need Resources and Capacities.
It will be challenging to bring all of this together, even more so if you have various software tools from different vendors in use.
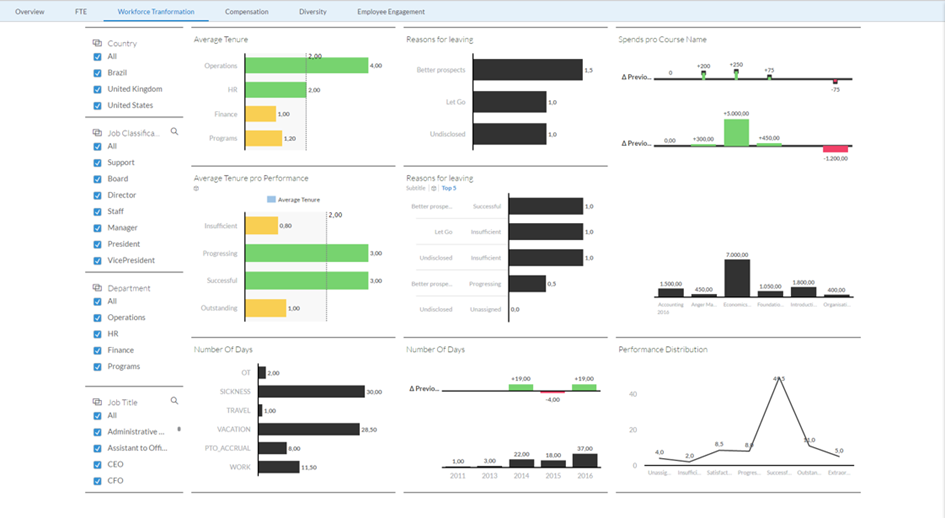
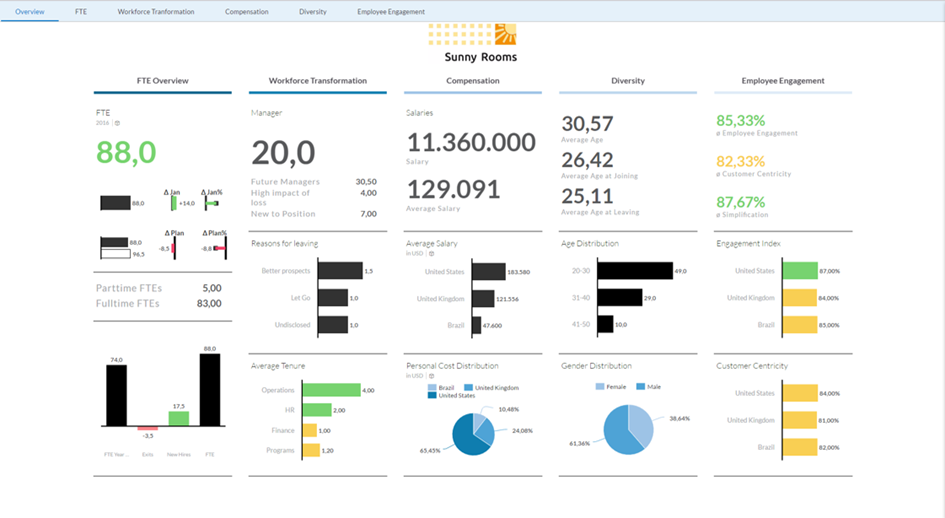
The SAP Analytics Cloud is a viable solution to tackle this challenge and add Predictive, ML and AI functionalities to your data and get insights faster since it can be managed by the HR department with minimal IT involvement. It is a true enabler and empowers the business user.
Our Expertise
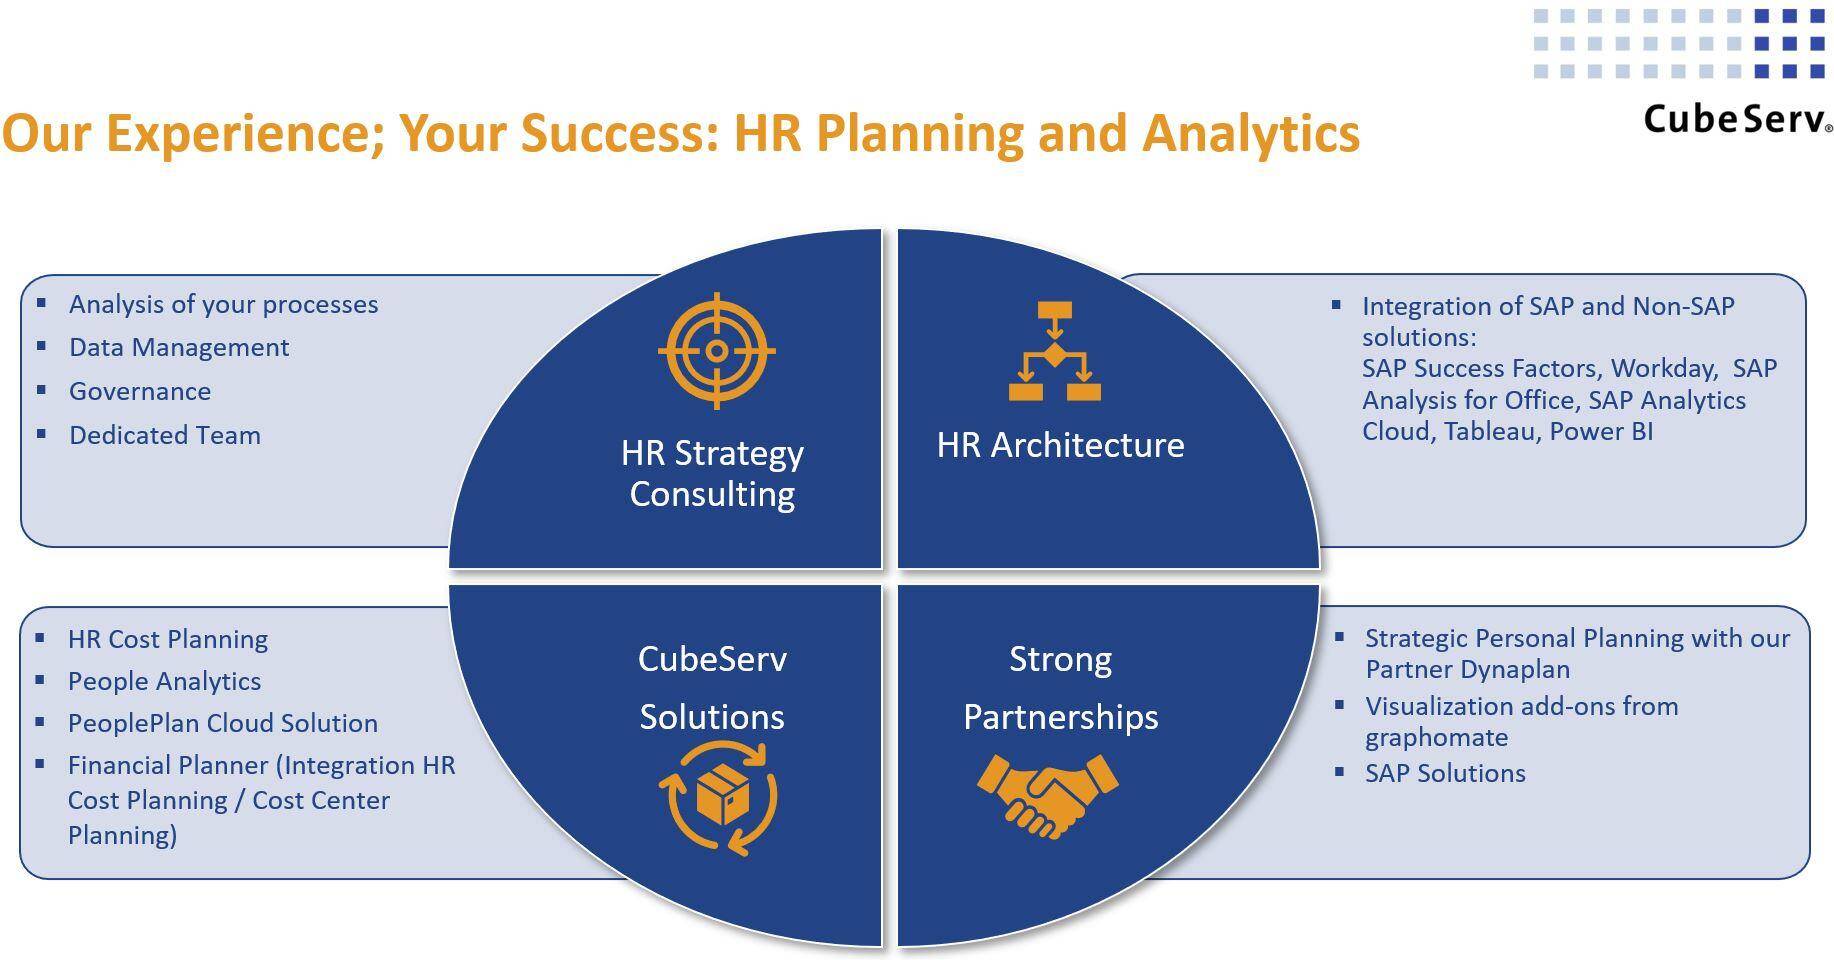
We have built HR Analytics and Reporting solutions for over 15 years and understand the need of a HR organisation inside out. Our dedicated team speaks „HR“.
Having nice dashboards, reports and analysis is only half the rent. Once you have your headcount and numbers in order, you have an excellent data base for personnel cost planning.
The underlying data model reflects all the organisational changes over time and gives you the choice to work with actual hierarchies or previous hierarchies.
We often encountered that employees get “lost” during the planning cycle when their organisation changes. The planning cycles are long, cumbersome and error prone due to several media breaks along the way. Our solutions address this problem based on a flexible workflow which fits to your organisation.
With the right solution in place, you can Empower the business and Embed People Analytics in your normal processes.
PeoplePlan
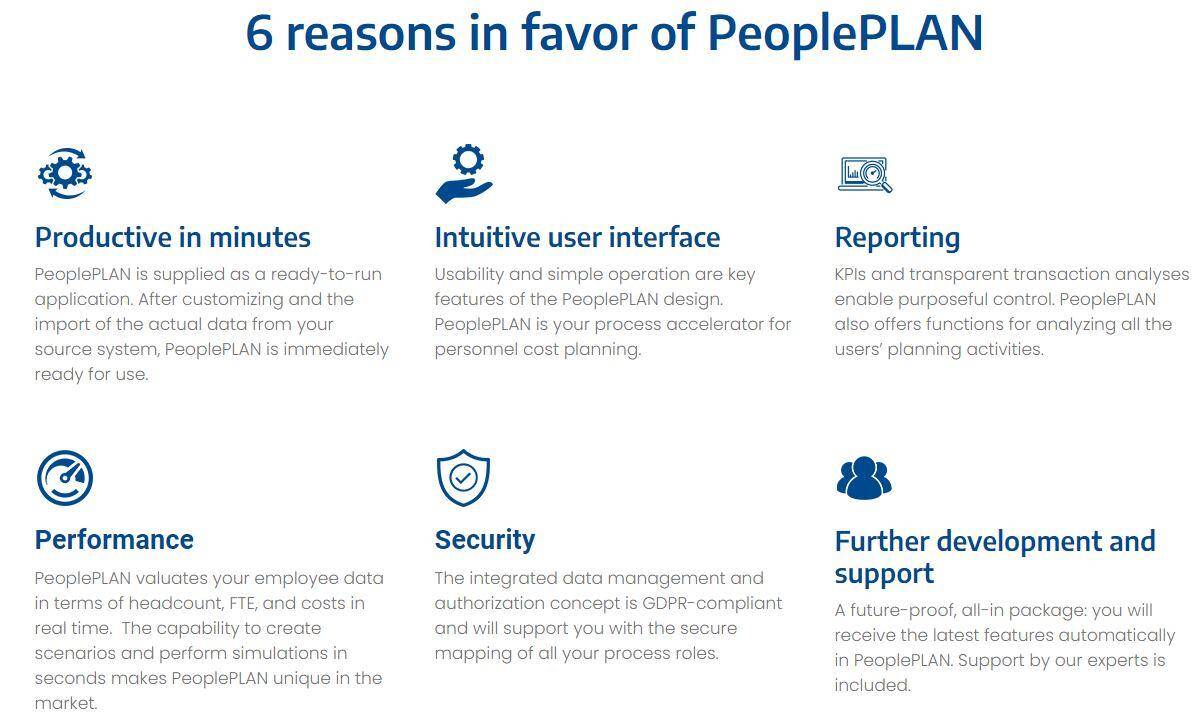
Based on our long experience, we developed PeoplePlan, a lean cloud-based personnel cost planning solution.
The solution can consume raw data from about any HR system and is fast up and running.
Further information can be found www.peopleplan.eu/en
HR Analytics – SAP Analytics Cloud
Apart from above solution, we have several packages available which are based on the latest SAP BW solutions and make use of the vast function and features of the SAP Analytics Cloud.
The SAP Analytics Cloud lets you combine Finance, Controlling, HR data for your reporting. Furthermore, you can make use of the Augmented Analytics capabilities to get further insight into your data supported by machine learning. The best is, the solution is build for the business i.e. you can build, create and maintain your dashboards without relying on the IT department
Our solutions help you to be a strong Business Partner who doesn’t just deliver reports but also delivers a true value-add to the organisations, anytime, anywhere and on any device.

There is no time nor need to start experiments if it comes to your most precious “assets” in the company. Therefore, take advantage from our experience based on many projects in various industries and various company sizes.
Interested?
Did I manage to get your attention?
Interested to learn more? Let’s talk, Let’s do a demo and feel free to look at:
- Website: SAP Analytics Cloud
- Website: CubeServ HR Analytics
- Website: CubeServ HR Personalkostenplanung
- Website: HR Reporting mit SAP Analytics Cloud
- Webinar: Personalkostenplanung in Krisenzeiten: Was Sie jetzt wissen müssen!
- Webinar: PeoplePLAN: Personalkostenplanung in Echtzeit. Die neue SaaS-Lösung von CubeServ!
- Webinar: Evidence based HR Controlling: Predictive Analytics & smarte Planung
Vereinbaren Sie jetzt Ihren Expert Call. Wir freuen uns über Ihre Nachricht.

Roland J. Merz
Passionate about Business Intelligence, Finance and Controlling processes. Senior Executive with over 30 years experience in Asia and DACH Region whereof over 20 years experience in the Business Intelligence area. My goals working with you: To inspire and thrill people - To focus - To create growth for both my clients and my firm.

